


CN Graphs & Charts
- 定价
-
提供免费套餐。 提供免费试用。
- 亮点
- 适用于最新模板
- 评分
- 5.0 (2)
- 开发人员
- Common Ninja
配图图库


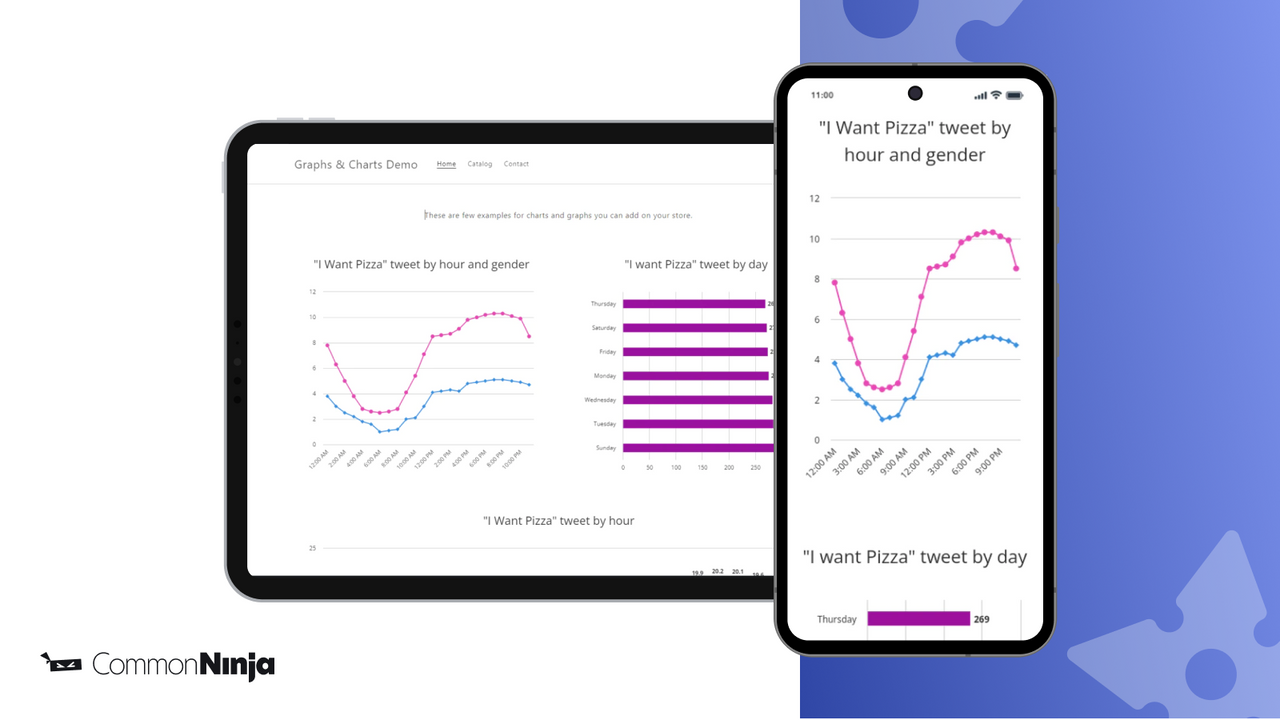


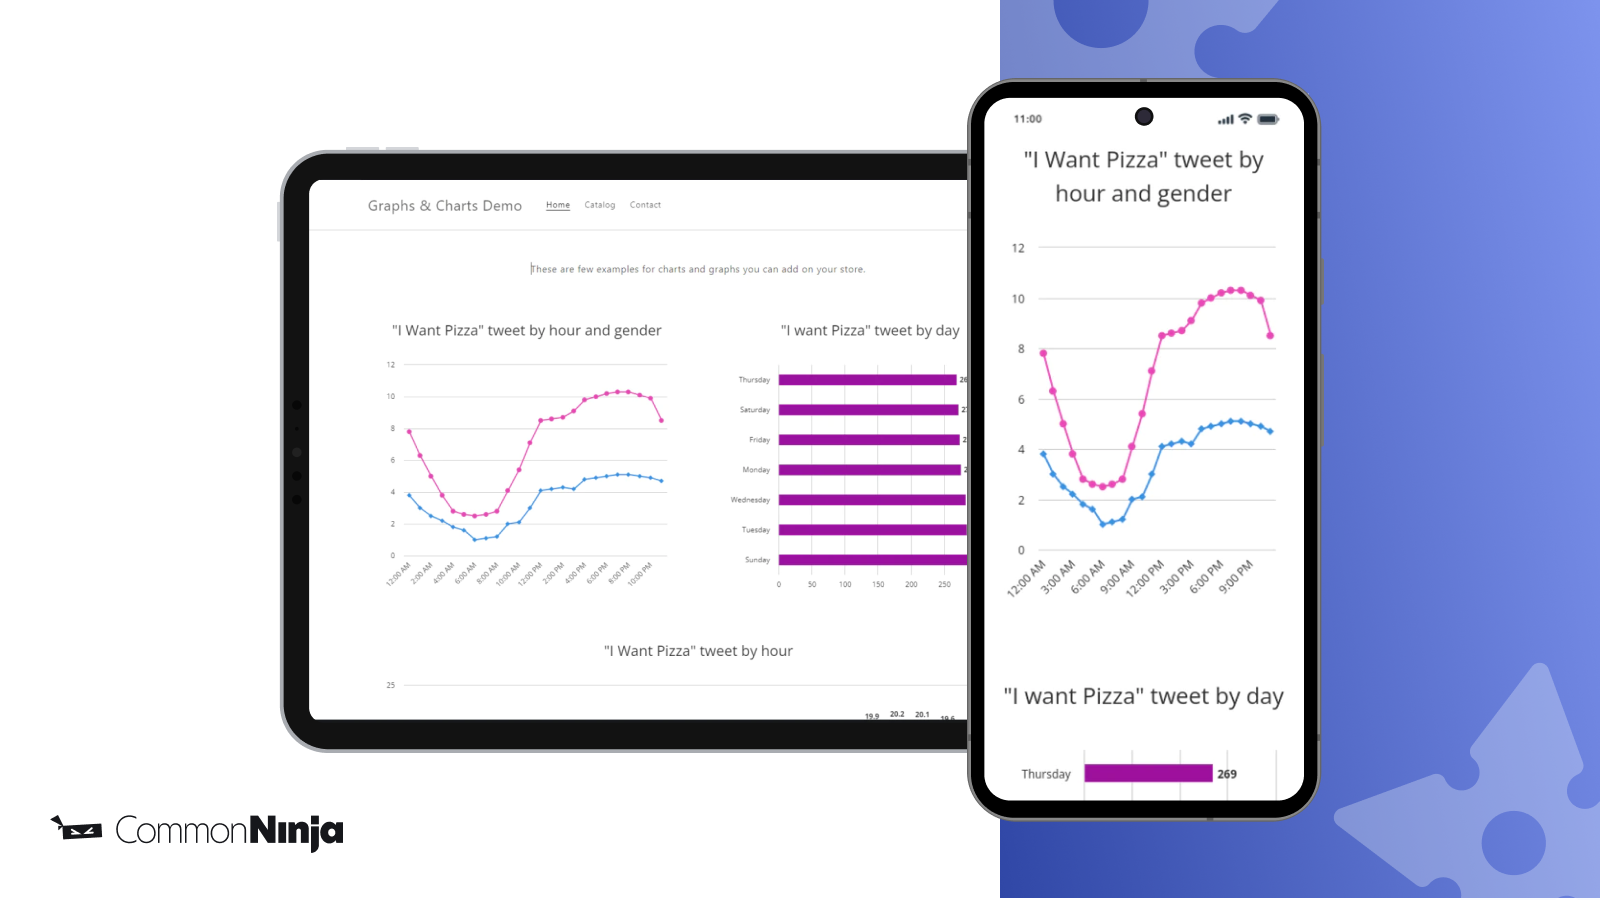
Turn your store’s data into sales with stunning, interactive charts that drive conversions.
Transform store data into visuals that sell. Create 20+ chart types, from bar to interactive pie, and place them anywhere in your store to grab attention and keep visitors engaged. Import from CSV or Google Sheets for instant updates, or connect live data sources for automatic refreshes. Customize colors, fonts, and layouts to perfectly match your brand. Ideal for product comparisons, tracking promotions, and showcasing customer reviews. Fully responsive, lightning-fast, and designed to turn b
- 20+ chart types to present store data, engage visitors, and boost sales.
- Auto-sync from CSV or Sheets to keep your charts up to date.
- Professional templates to launch stunning charts in under 2 minutes.
- Full brand control with custom fonts, colors, and chart layouts.
- Embed charts anywhere, products, blogs, or landing pages.
包含未翻译的文本
- 亮点
- 适用于最新模板
语言
英语
这款应用未翻译成简体中文
适配以下产品:
- csv
- Google Drive
- Notion
- Airtable
- XML
- One Drive
定价
Free Plan
免费
- 2 Charts
- 1 Series
- 10 Data rows
- 3 Charts types
- Custom fonts
Basic Plan
$5 /月
或 $48/年(可节省 20%)
- 10 Charts
- 3 Series
- 30 Data rows
- 6 Charts types
- Custom design
- Ads Removal
3 天免费试用
Pro Plan
$10 /月
或 $96/年(可节省 20%)
- 200 Charts
- 10 Series
- 500 Data rows
- 13 Charts types
- CSV Importer
- Auto data refresh
- Ads Removal
3 天免费试用
Business Plan
$15 /月
或 $144/年(可节省 20%)
- 1,000 Charts
- 50 Series
- 5,000 Data rows
- 20 Charts types
- Dynamic data from URL
- CSV importer
- Ads Removal
3 天免费试用
包含未翻译的文本
所有费用均以USD结算。 定期费用和基于使用情况的费用每 30 天收取一次。
Customer service is amazing. They respond quickly and tried to help me with problem I had. Eventually, we got it figured out. I highly recommend this app!
I searched all over looking for an interactive graph & charting app that would be able to show a visual representation of data. This is a great tool to use when you have a product that may be simial to your competition but you have the ability to show the data in an interactive visual graph or chart that sets you apart from the competition. I had a visual issue with how the line graph was appearing on a mobile device and I reached out to the support team over at Common Ninja and worked with Daniel who provided me with a quick and precise solution to the visual issue I was experiencing. I'm looking forward to seeing what the team over at Common Ninja is able to develop for more interactive and complex graph plotting abilities in the future.
支持
应用支持由 Common Ninja 提供。
或访问支持门户