


Sales & Inventory Dashboard
- 定價
-
提供免費方案
- 評分
- 0.0 (0 評價)
主要圖片圖庫


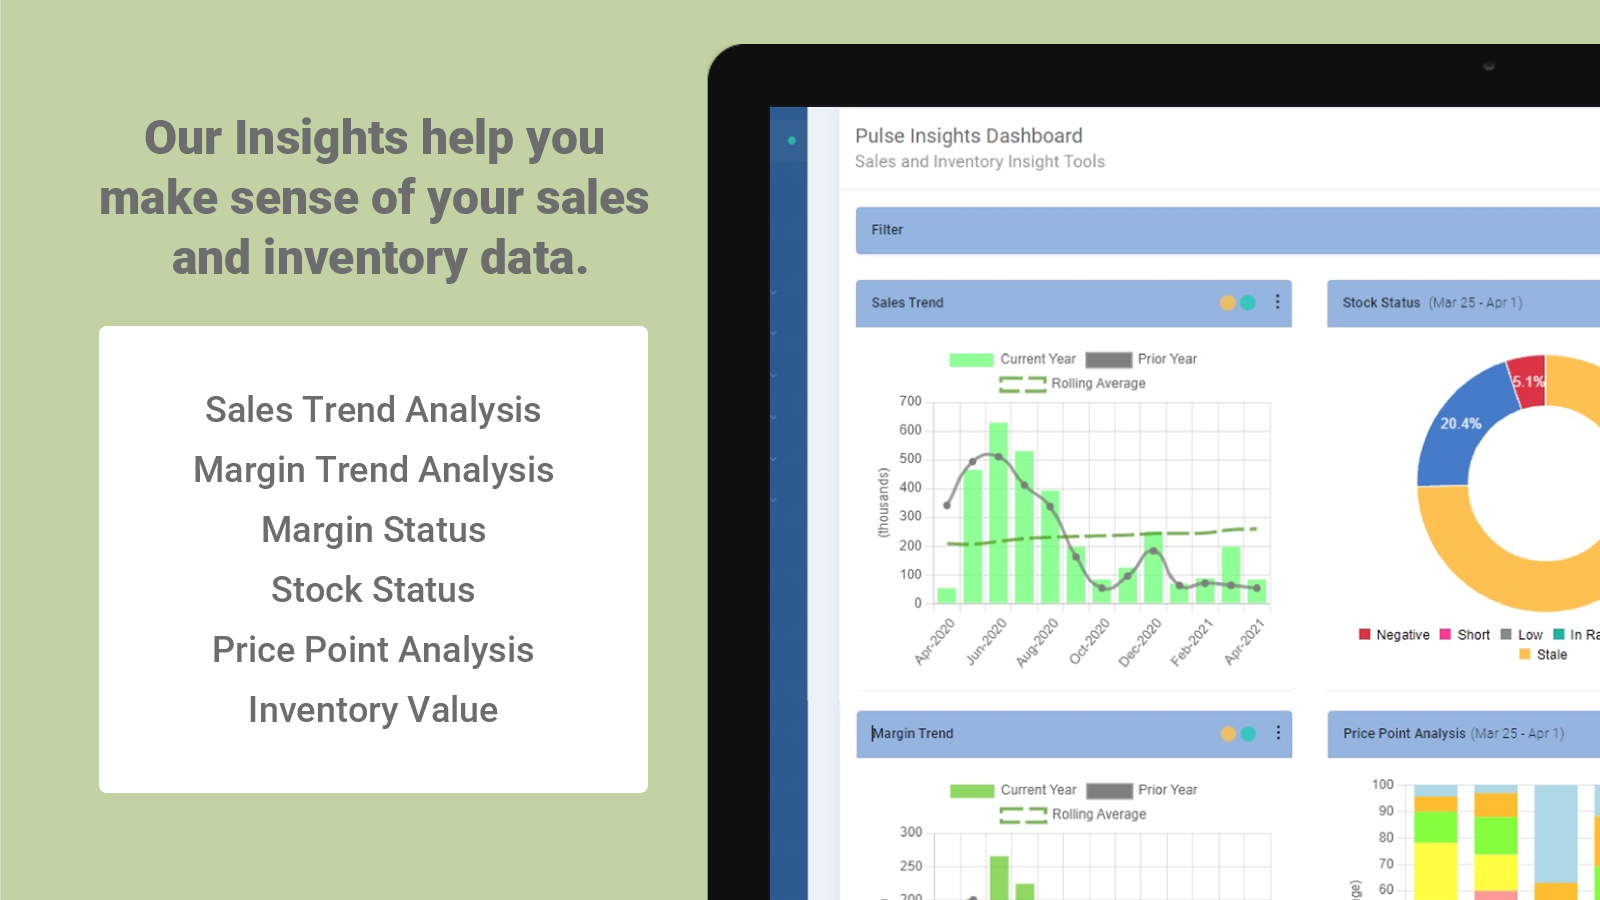


Our Insights provides specialized analysis to help you analyze your sales and inventory performance.
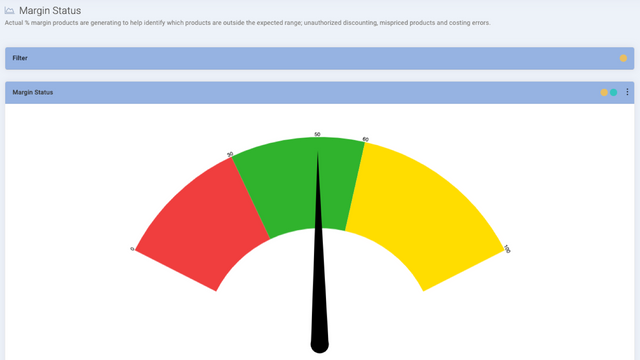
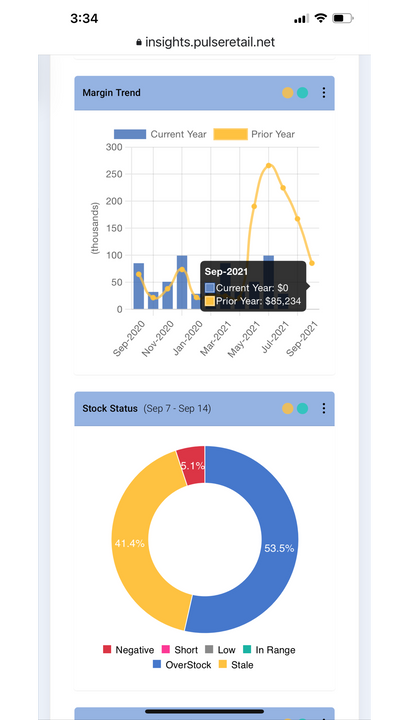
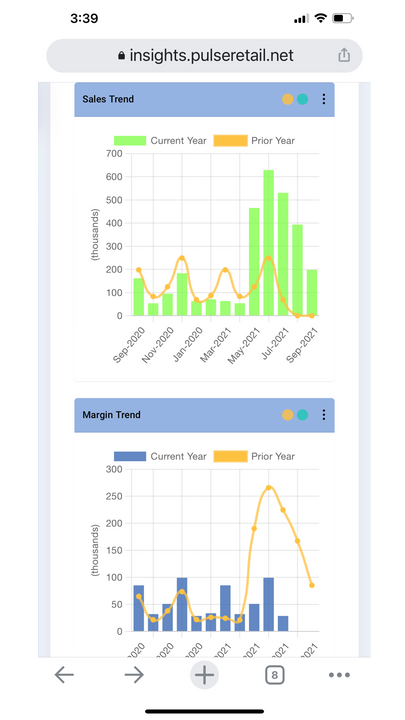
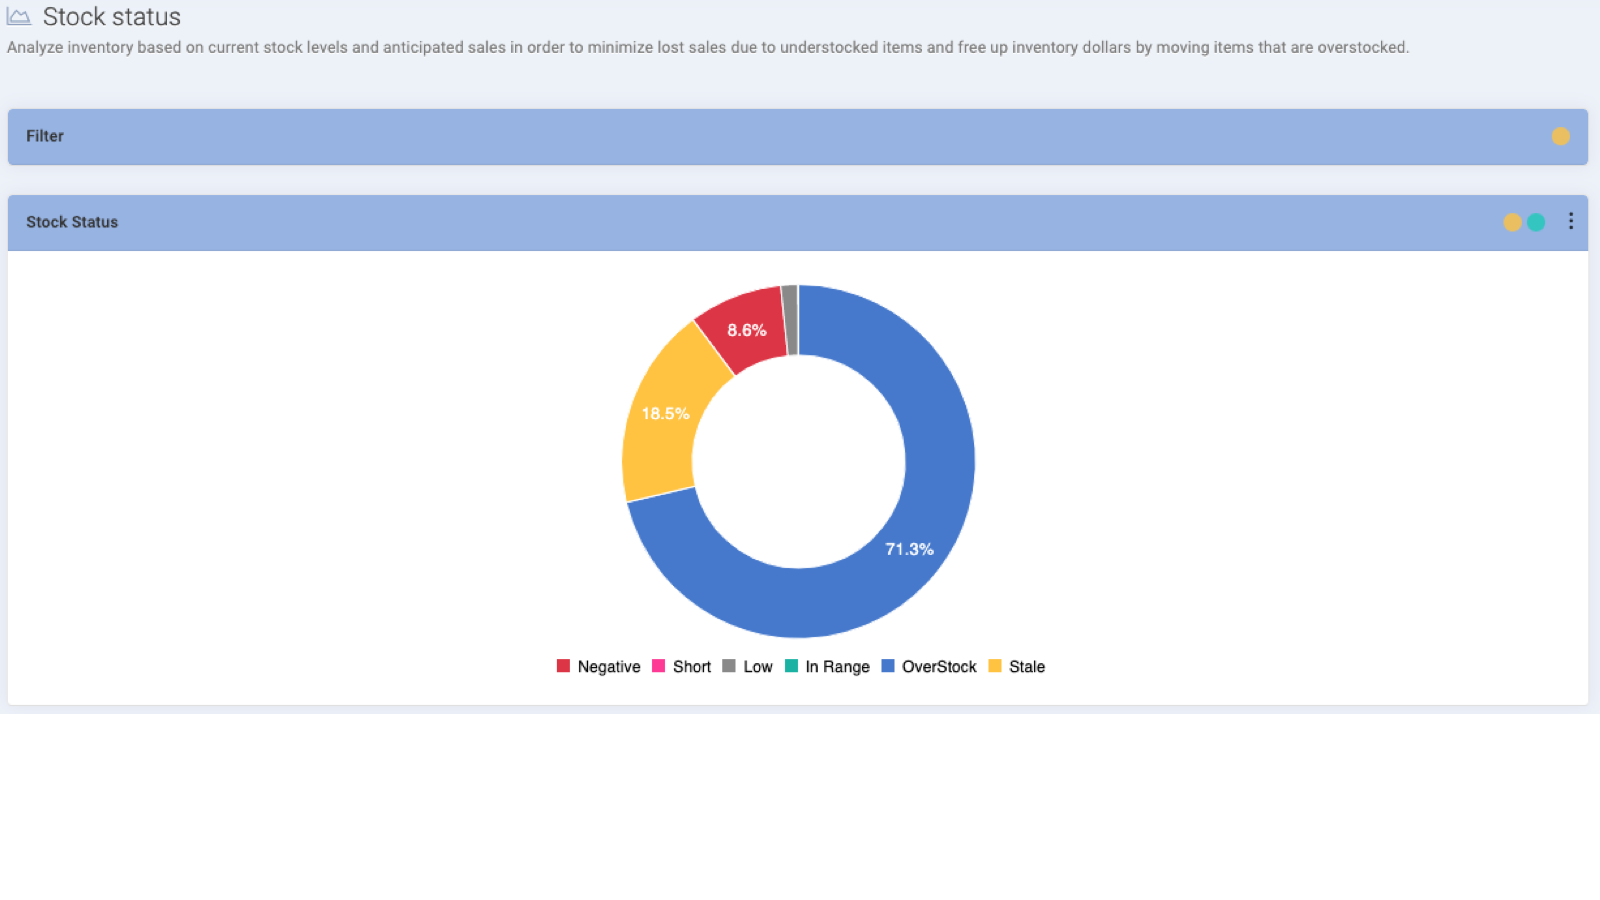
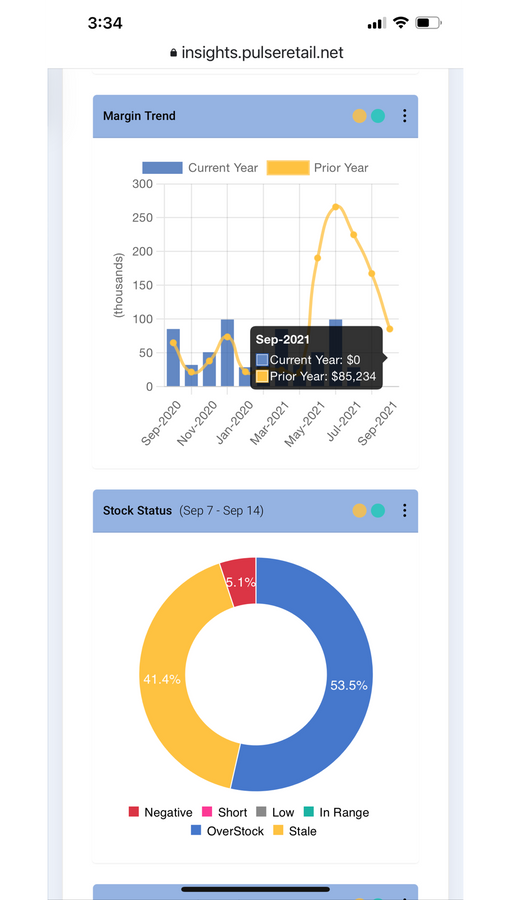
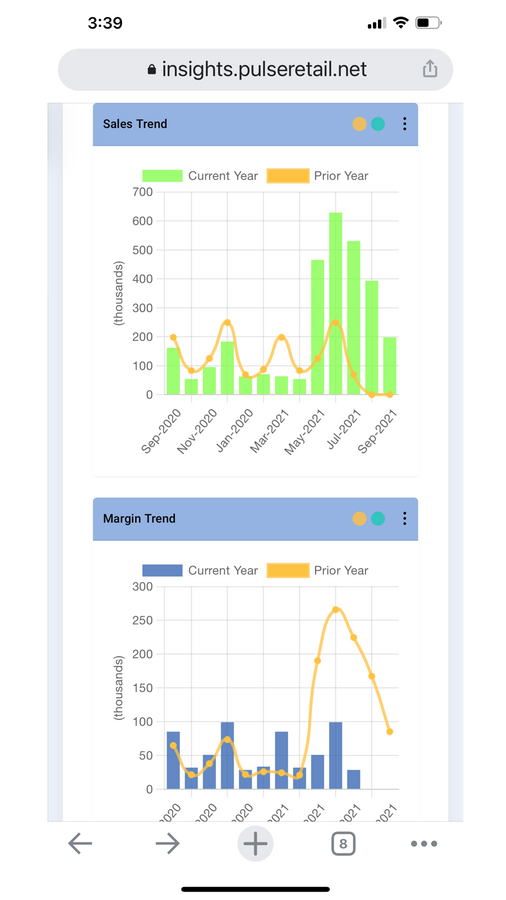
Specialized analysis to help you make sense of your sales and inventory data and allow you to make critical decisions when they need to be made. We help you: * Analyze 12-month sales & margin trends with prior year & rolling average comparisons. * Evaluate purchase patterns using our price point analysis. * Identify outperforming & underperforming products by analyzing your inventory stock levels. * View actual % margin products are generating. * View a breakdown of current inventory values.
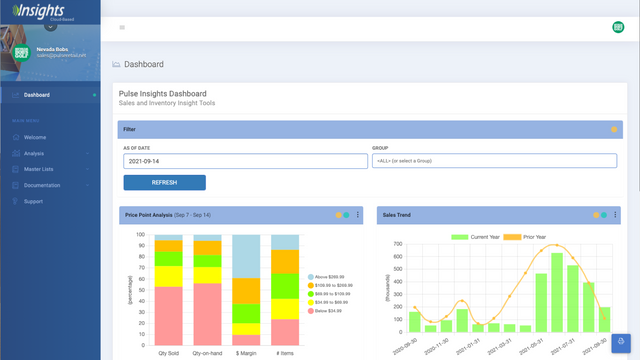
- Dashboard for at-a-glance graphical analysis of your sales and inventory.
- Charts provide clarity for sales & margin trends and stock requiring attention.
- Data grids provide detail behind the charts with grouping, sorting and export.
- Advanced analysis with filtering by groups, departments, locations and more.
- Automated scheduled data synchronization with paid subscriptions.
語言
英文
這項應用程式尚未翻譯成繁體中文
可與以下項目搭配使用
- QuickBooks
- ReACT EKG
類別
定價
Basic
免費
- 1 User
- Manual Sync (Max 30 Days History)
- Inventory Values & Sales Trend Analysis
- 2 Categorization Levels
- 1 Year Data Retention
- Email Support
Extended
$39 /月
- Up to 2 Users
- Auto Daily Sync (Max 6 Months History)
- All Analysis Tools
- 4 Categorization Levels
- 2 Years Data Retention
- Email & Chat Support
Expert
$99 /月
- Up to 3 Users
- Auto Hourly Sync (Max 1 Year History)
- All Analysis Tools
- 7 Categorization Levels
- 5 Years Data Retention
- Email & Chat Support
所有費用均以 USD 計價。 定期費用和依使用量計費方案,均以 30 天為週期收費。 查看所有定價選項
支援服務
應用程式支援由 Pulse Retail Systems 提供。
資源
開發者無法直接以繁體中文提供支援。
開發者
發布日期
2022年5月13日