Easy Pie Chart
- การกำหนดราคา
-
$3.99/เดือน ทดลองใช้งานได้ฟรี
- การให้คะแนน
- 0.0 (0 รีวิว)
- ผู้พัฒนา
- トラストリング株式会社
แกลเลอรีรูปภาพที่แสดง


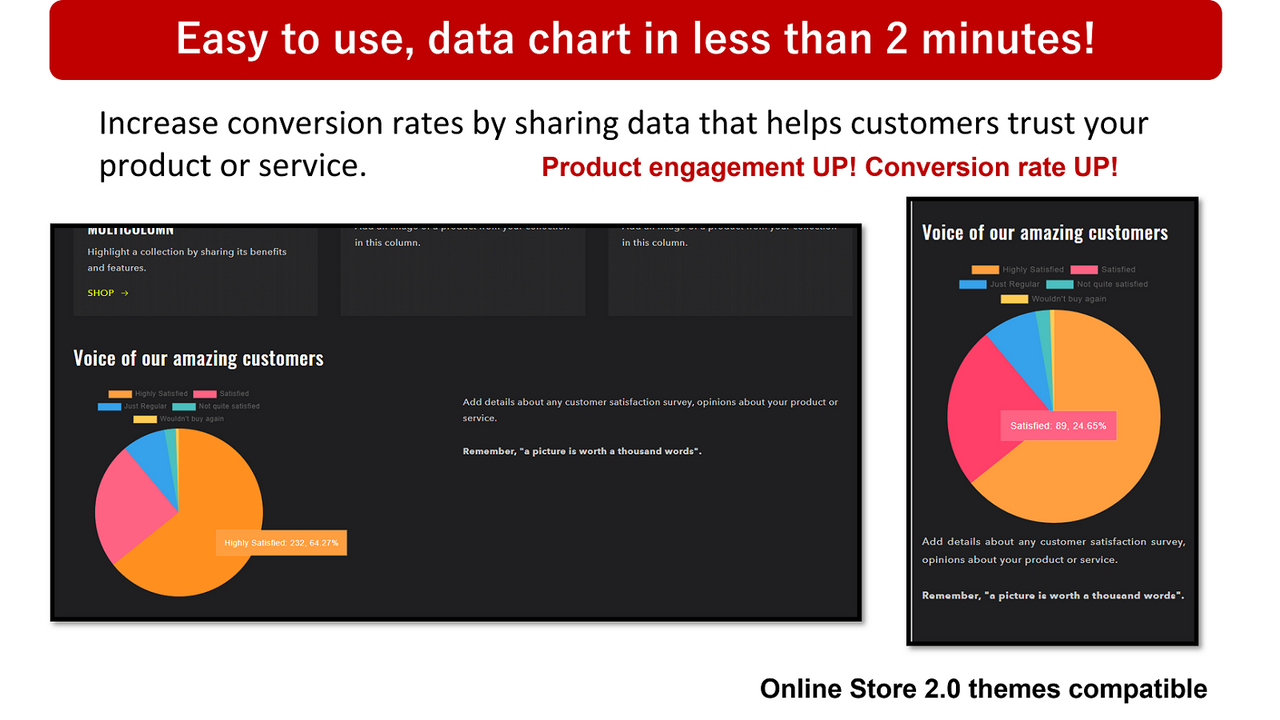


Add product/service data stats to any page with no code in less than 2 minutes! Conversion rate UP!
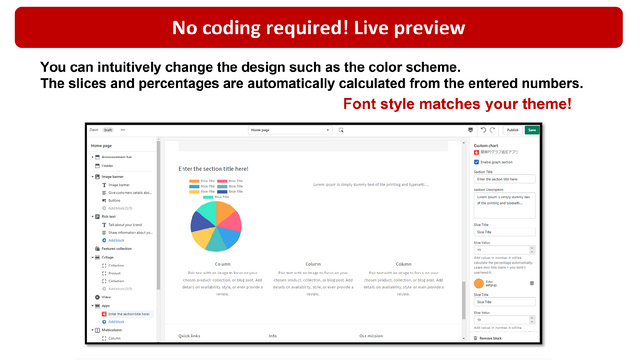
Increase conversion rates by sharing data that helps customers trust your product or service. With Easy Pie Chart you can easily create a pie chart just by entering the data numerical values, in less than 2 minutes. All done from the theme’s customizer. You can intuitively change the design such as the color scheme. The graph percentage is automatically calculated from the entered numbers. Installation completed with 1 click. Fully responsive and compatible with Online Store 2.0 themes.
- No coding required! Create a data chart from the theme’s customizer.
- Easy to use! Percentages are automatically calculated just pick a color scheme.
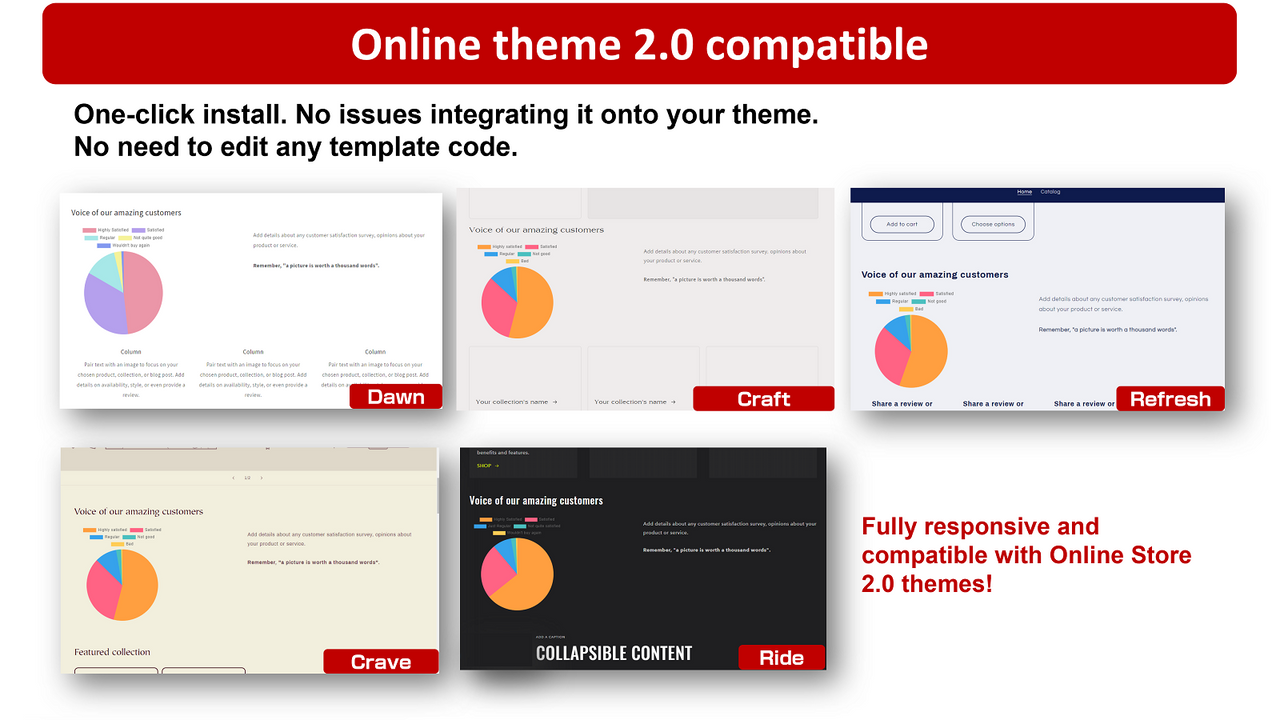
- Online Store 2.0 themes compatible and responsive.
ภาษา
ภาษาอังกฤษ และ ภาษาญี่ปุ่น
แอปนี้ไม่ได้แปลเป็นภาษาไทย
การกำหนดราคา
เลือกแผนที่เหมาะกับธุรกิจของคุณที่สุด
Single Plan
$3.99 / เดือน
ฟีเจอร์
- Unlimited charts on multiple pages
- Unlimited data color options
- More than 5 data slices
- Chart support text HTML customizable
ทดลองใช้งานฟรี 7 วัน
ค่าบริการทั้งหมดจะเรียกเก็บเป็น USD ค่าบริการที่เกิดขึ้นประจำและตามการใช้งานจะเรียกเก็บเงินทุกๆ 30 วัน ดูตัวเลือกการกำหนดราคาทั้งหมด
รีวิว
-
0% ของการให้คะแนนคือ 5 ดาว
-
0% ของการให้คะแนนคือ 4 ดาว
-
0% ของการให้คะแนนคือ 3 ดาว
-
0% ของการให้คะแนนคือ 2 ดาว
-
0% ของการให้คะแนนคือ 1 ดาว
ความช่วยเหลือ
ให้ความช่วยเหลือสำหรับแอปโดย トラストリング株式会社
แหล่งข้อมูล
ผู้พัฒนารายนี้ไม่มีการช่วยเหลือโดยตรงเป็นภาษาภาษาไทย
ผู้พัฒนา
เปิดตัวแล้ว
23 สิงหาคม 2022
