


Viz BI
- Priser
-
Pris: Gratis
- Vurdering
- 0,0 (0 Omtaler)
- Utvikler
- Wentworth Analytics Ltd.
Galleri med fremhevede bilder

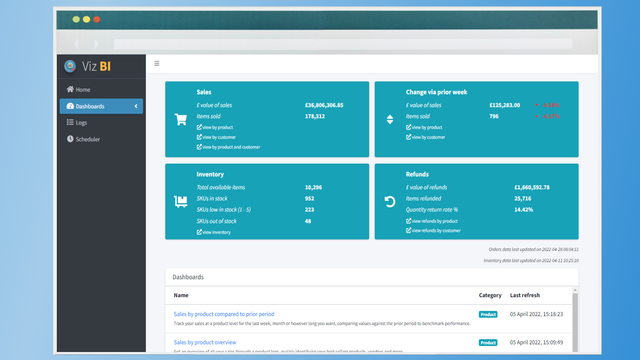

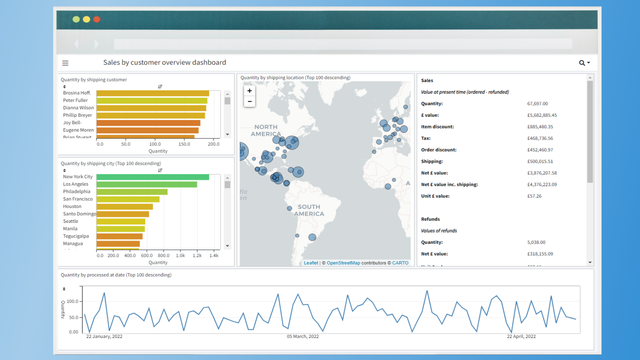

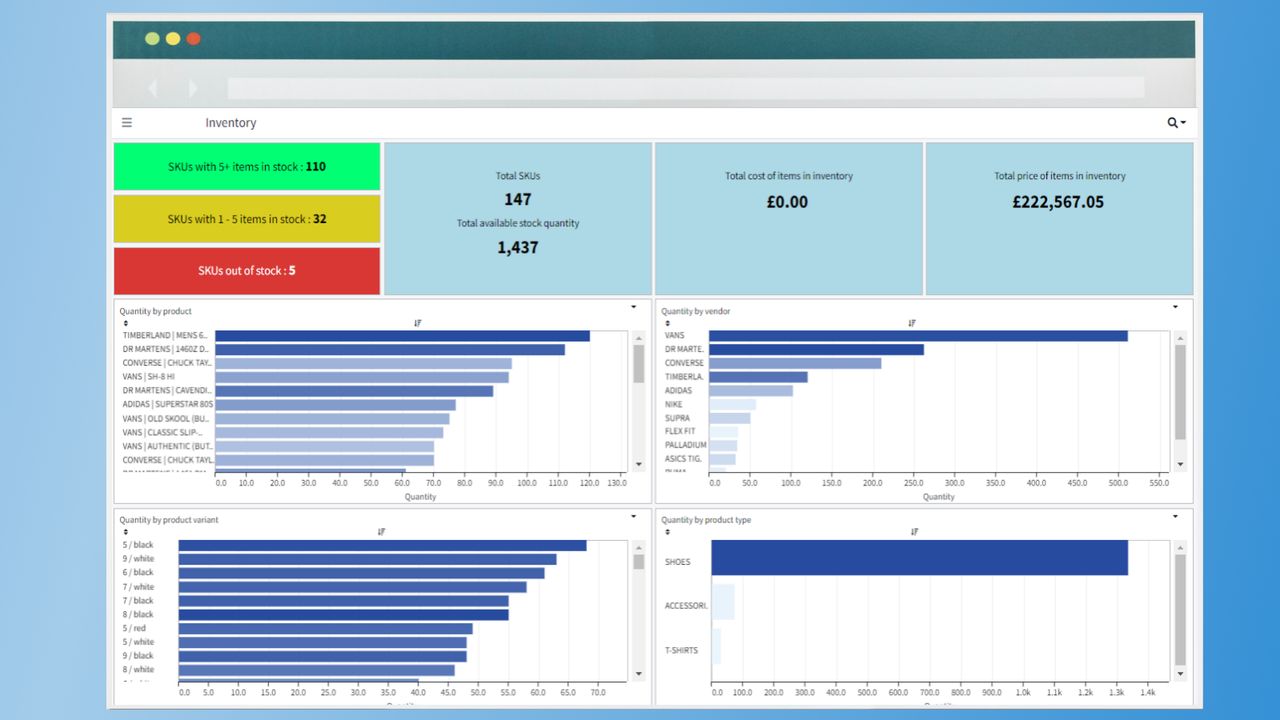
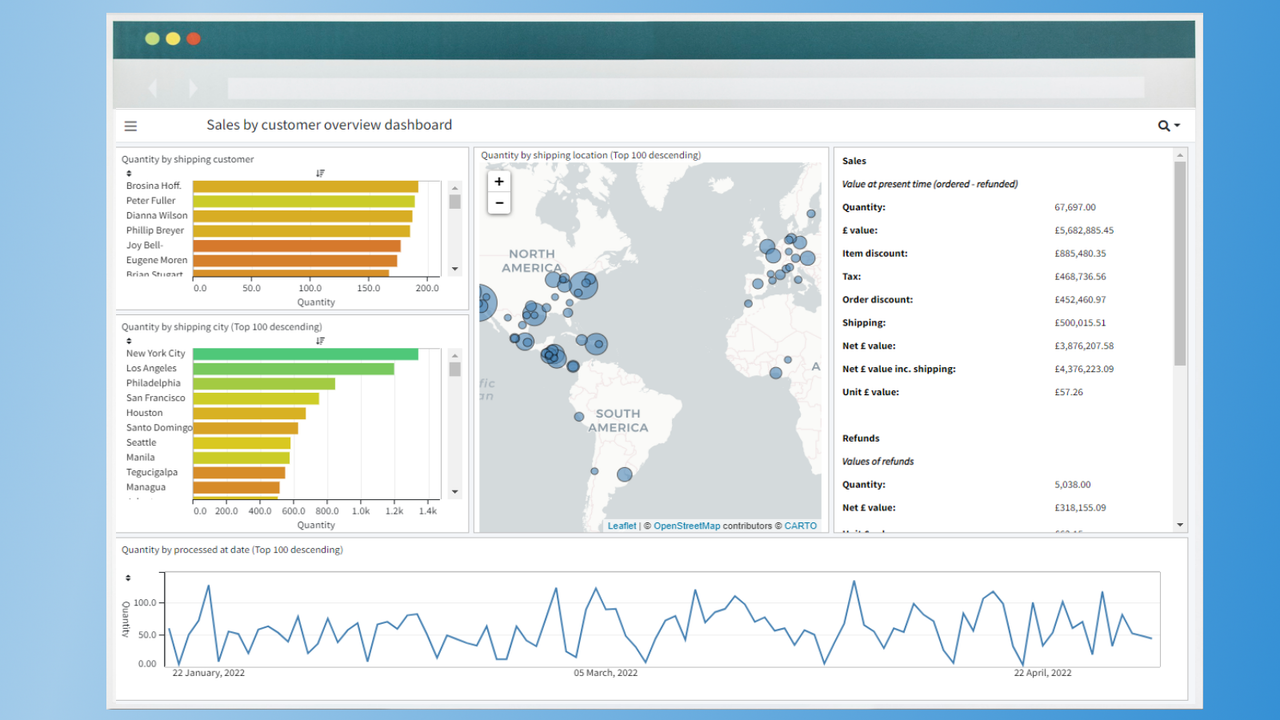
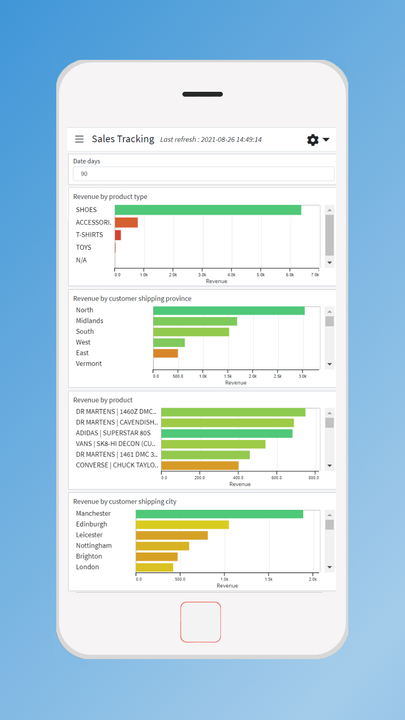

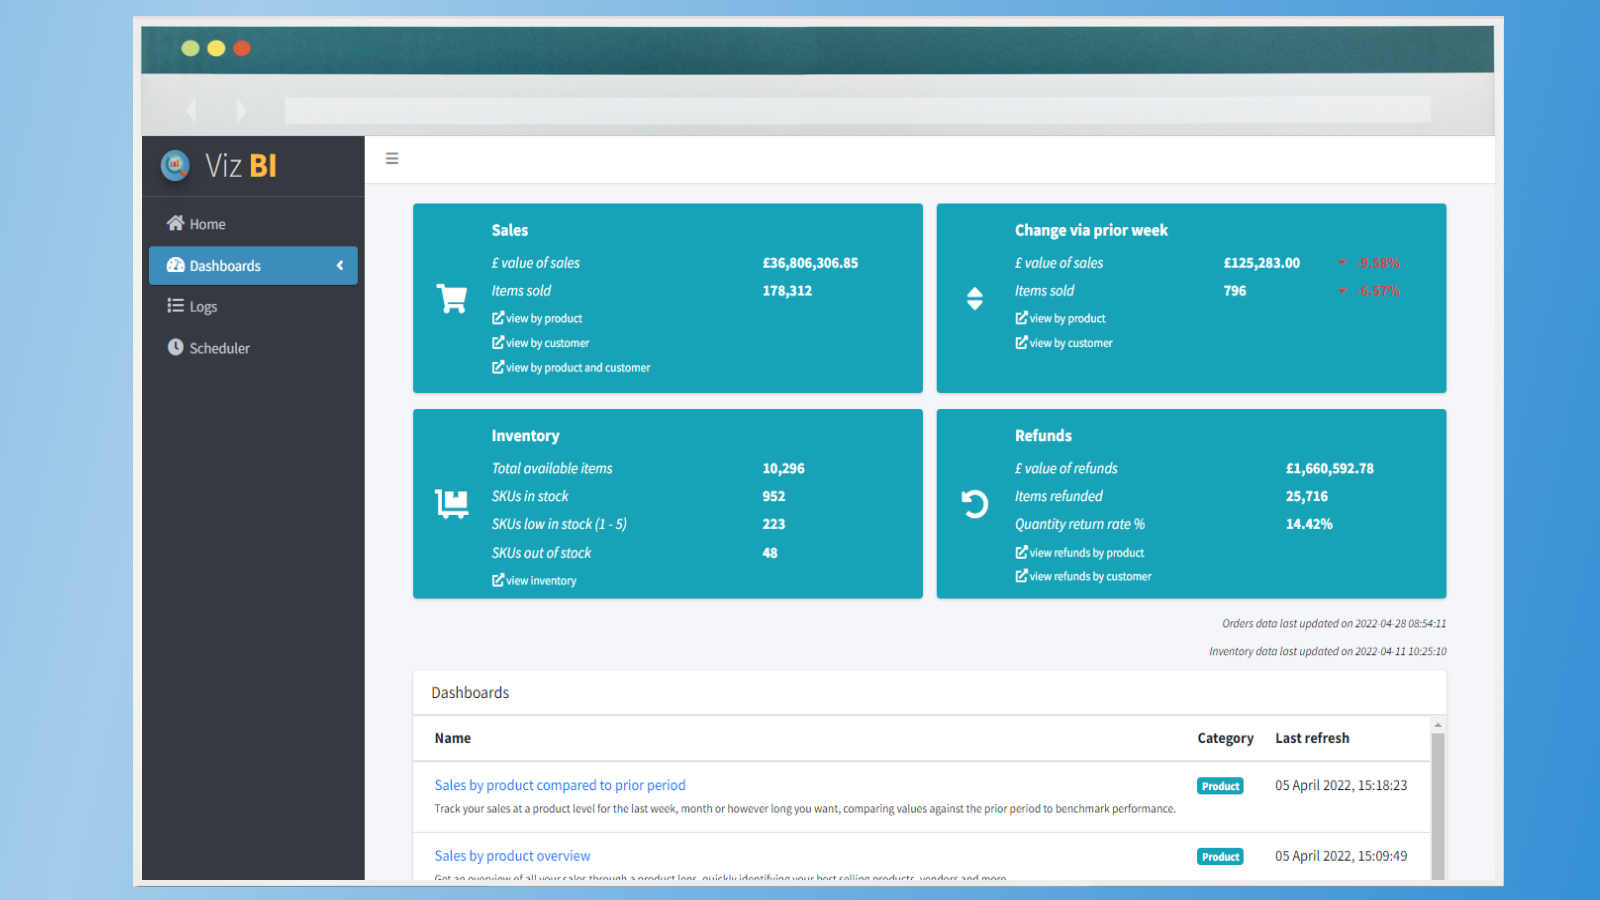


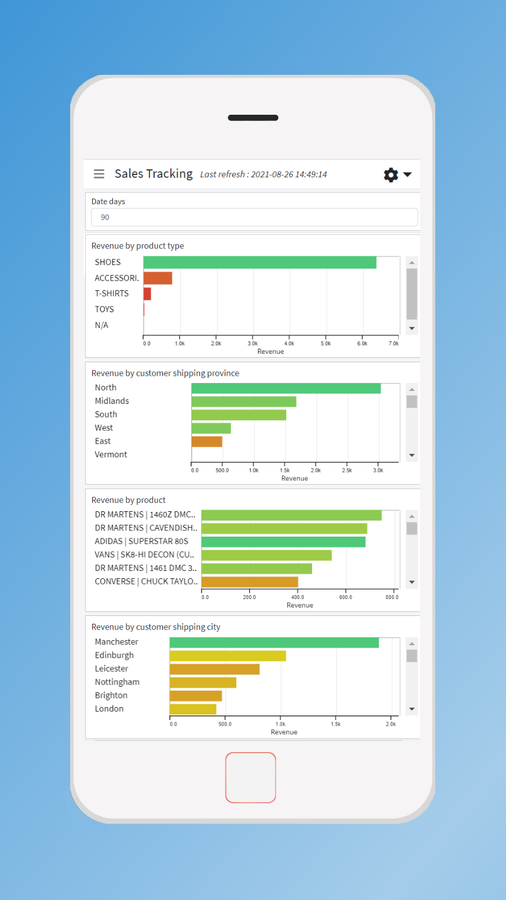
Viz BI provides a series of intuitive dashboards, allowing you to easily understand your store data
Viz BI takes your store data - orders, products, customers and more - and transforms it into interactive, easy to understand charts. These charts are then combined into dashboards, providing you with a full picture of your stores performance across a whole range of attributes. Within a matter of clicks you can : • follow which products are trending and which are falling • identify problem items that keep being returned • keep check of inventory, ensuring top sellers are always available
- Track and compare performance across date periods of your choice
- Interactive charts means one click of a bar will filter the whole dashboard
- Simply switch your chart values between sales values, quantities, refunds + more
Språk
Engelsk
Denne appen er ikke oversatt til Norsk (bokmål)
Kategorier
Omtaler
-
0 % av vurderingene er 5 stjerner
-
0 % av vurderingene er 4 stjerner
-
0 % av vurderingene er 3 stjerner
-
0 % av vurderingene er 2 stjerner
-
0 % av vurderingene er 1 stjerner
Brukerstøtte
Wentworth Analytics Ltd. kan besvare eventuelle spørsmål du har om Viz BI.
Utvikler
9, Wentworth Park Avenue, Birmingham, ENG, B17 9QU, GB
Ressurser
Denne utvikleren tilbyr ikke direkte støtte på Norsk (bokmål).
Lansert
18. oktober 2021