


Viz BI
- การกำหนดราคา
-
ราคา: ฟรี
- การให้คะแนน
- 0.0 (0 รีวิว)
- ผู้พัฒนา
- Wentworth Analytics Ltd.
แกลเลอรีรูปภาพที่แสดง

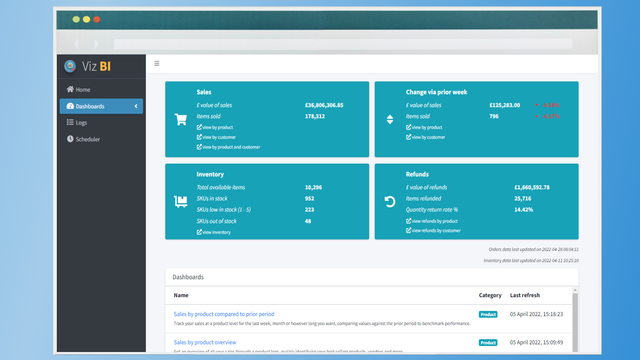


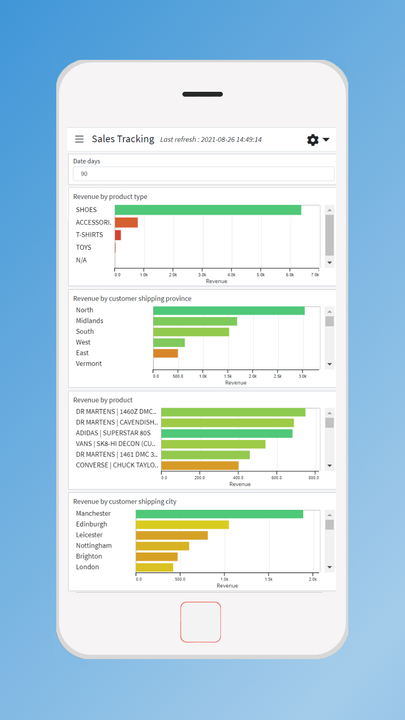

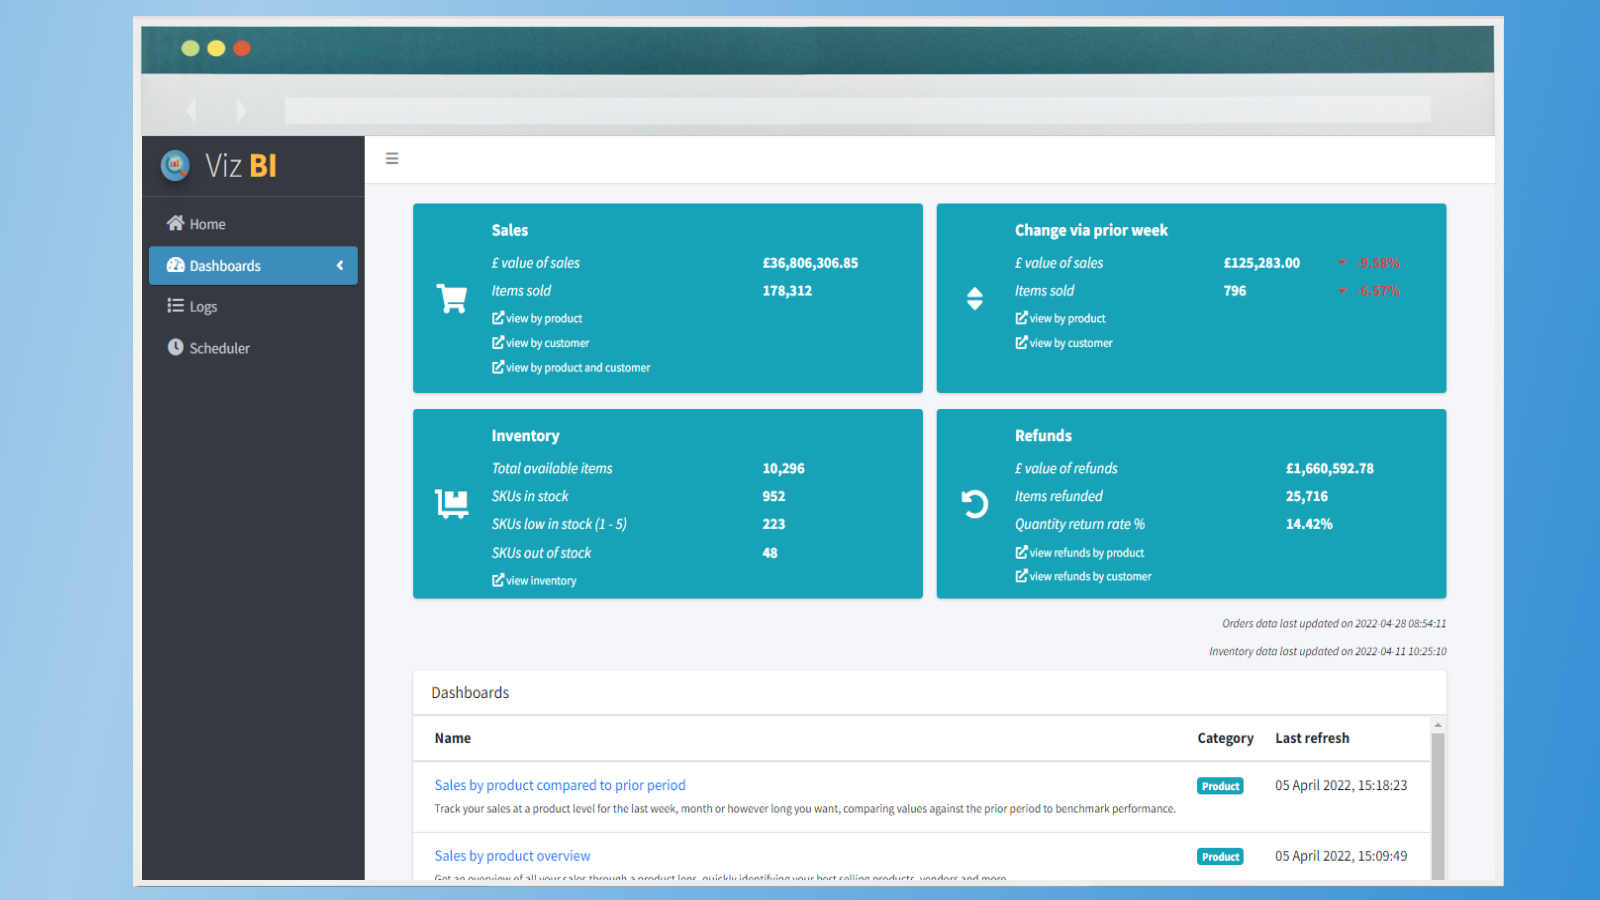


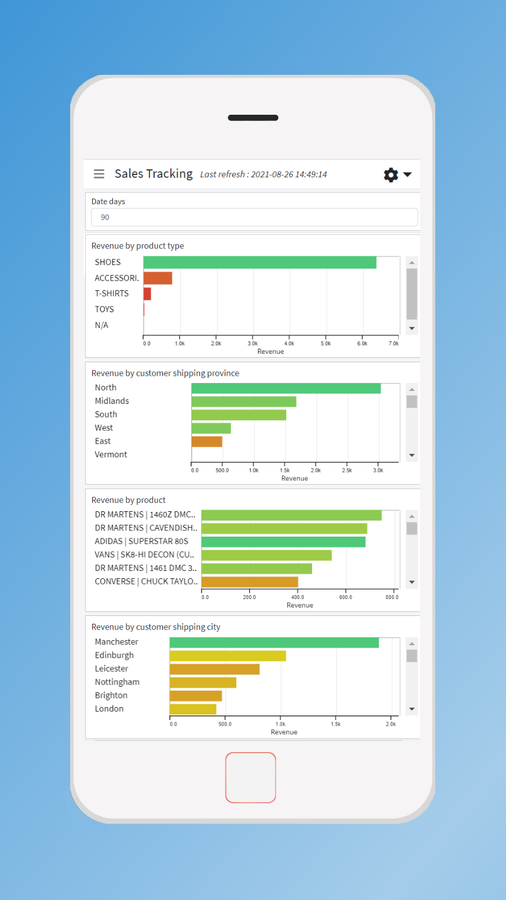
Viz BI provides a series of intuitive dashboards, allowing you to easily understand your store data
Viz BI takes your store data - orders, products, customers and more - and transforms it into interactive, easy to understand charts. These charts are then combined into dashboards, providing you with a full picture of your stores performance across a whole range of attributes. Within a matter of clicks you can : • follow which products are trending and which are falling • identify problem items that keep being returned • keep check of inventory, ensuring top sellers are always available
- Track and compare performance across date periods of your choice
- Interactive charts means one click of a bar will filter the whole dashboard
- Simply switch your chart values between sales values, quantities, refunds + more
ภาษา
ภาษาอังกฤษ
แอปนี้ไม่ได้แปลเป็นภาษาไทย
รีวิว
-
0% ของการให้คะแนนคือ 5 ดาว
-
0% ของการให้คะแนนคือ 4 ดาว
-
0% ของการให้คะแนนคือ 3 ดาว
-
0% ของการให้คะแนนคือ 2 ดาว
-
0% ของการให้คะแนนคือ 1 ดาว
ความช่วยเหลือ
Wentworth Analytics Ltd. สามารถตอบข้อสงสัยที่คุณมีเกี่ยวกับ Viz BI ได้
ผู้พัฒนา
9, Wentworth Park Avenue, Birmingham, ENG, B17 9QU, GB
แหล่งข้อมูล
ผู้พัฒนารายนี้ไม่มีการช่วยเหลือโดยตรงเป็นภาษาภาษาไทย
เปิดตัวแล้ว
18 ตุลาคม 2021