


Viz BI
- 価格設定
-
価格:無料
- ハイライト
- 管理画面で直接操作
- 評価
- 0.0 (0 レビュー)
特集の画像ギャラリー

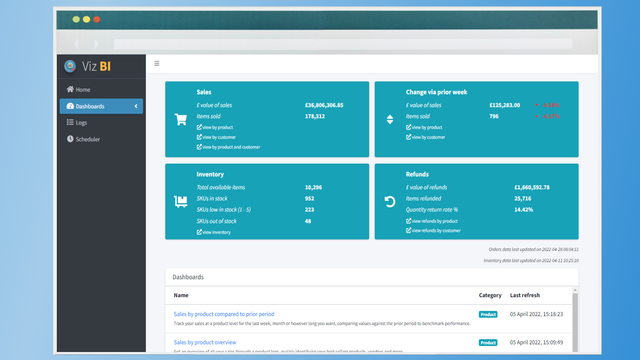


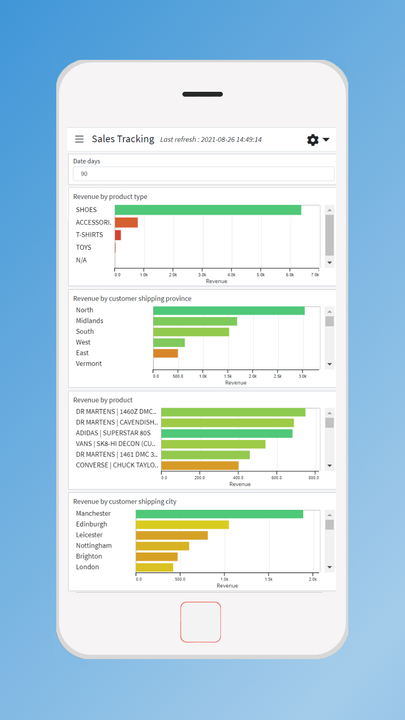


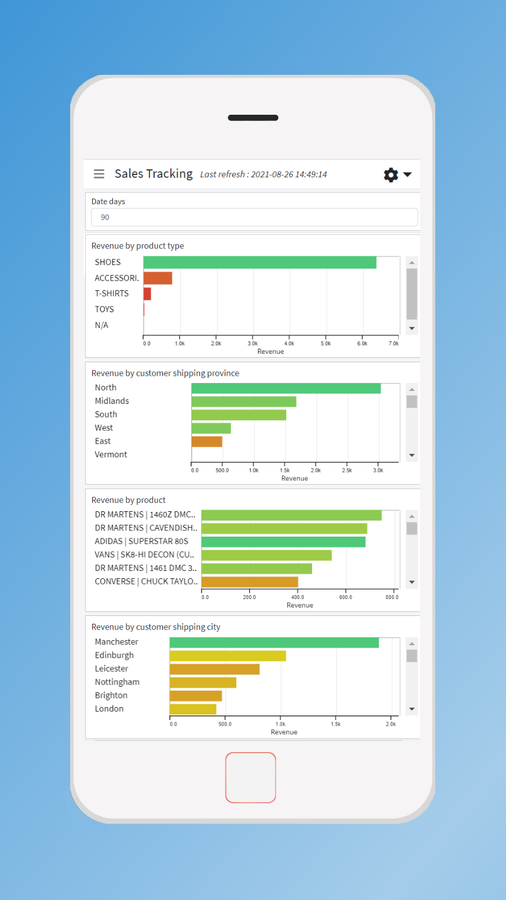
Viz BI provides a series of intuitive dashboards, allowing you to easily understand your store data
Viz BI takes your store data - orders, products, customers and more - and transforms it into interactive, easy to understand charts. These charts are then combined into dashboards, providing you with a full picture of your stores performance across a whole range of attributes. Within a matter of clicks you can : • follow which products are trending and which are falling • identify problem items that keep being returned • keep check of inventory, ensuring top sellers are always available
Viz BI takes your store data - orders, products, customers and more - and transforms it into interactive, easy to understand charts. These charts are then combined into dashboards, providing you with a full picture of your stores performance across a whole range of attributes. Within a matter of clicks you can :
• follow which products are trending and which are falling
• identify problem items that keep being returned
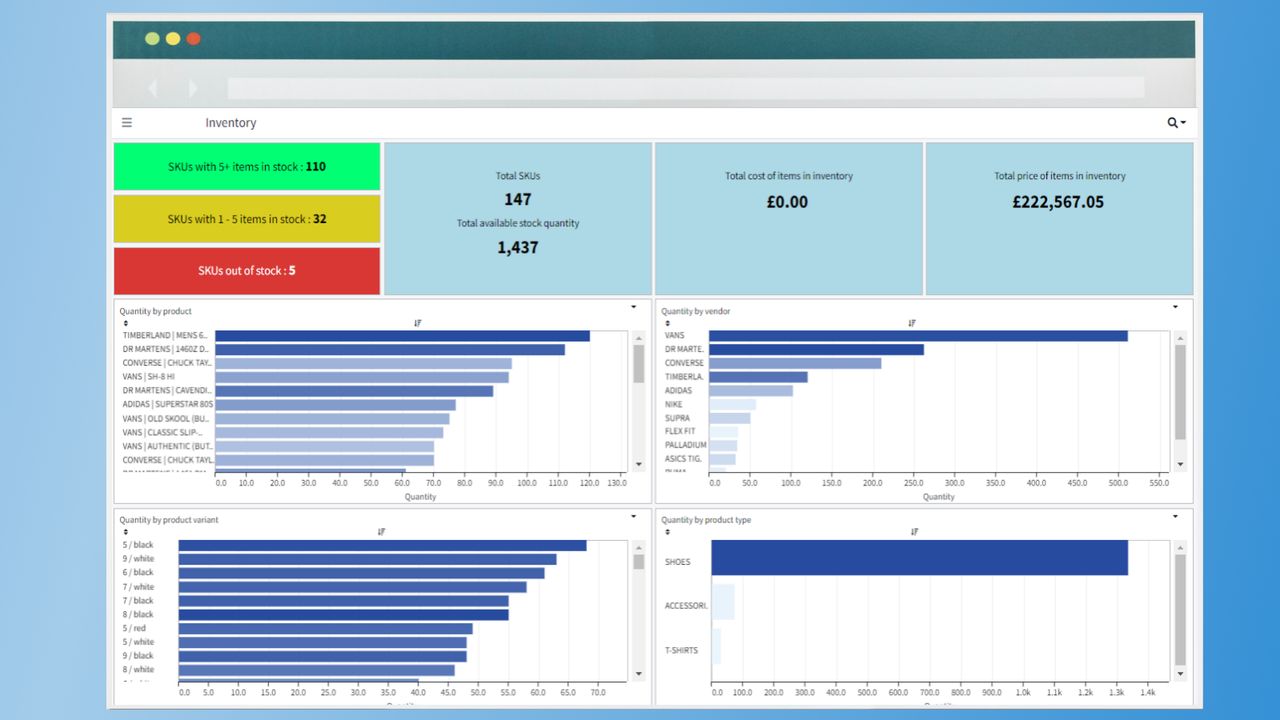
• keep check of inventory, ensuring top sellers are always available
さらに表示する
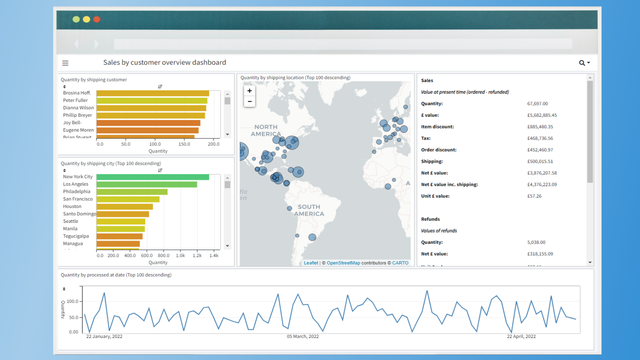
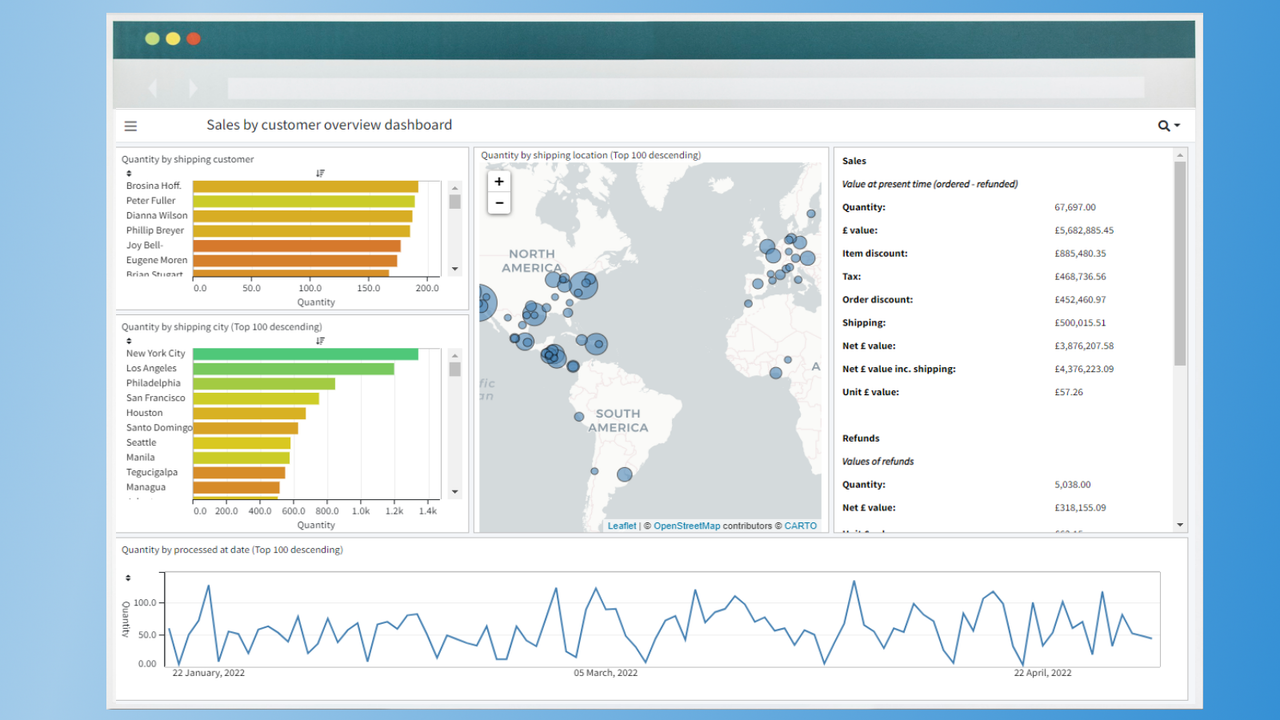
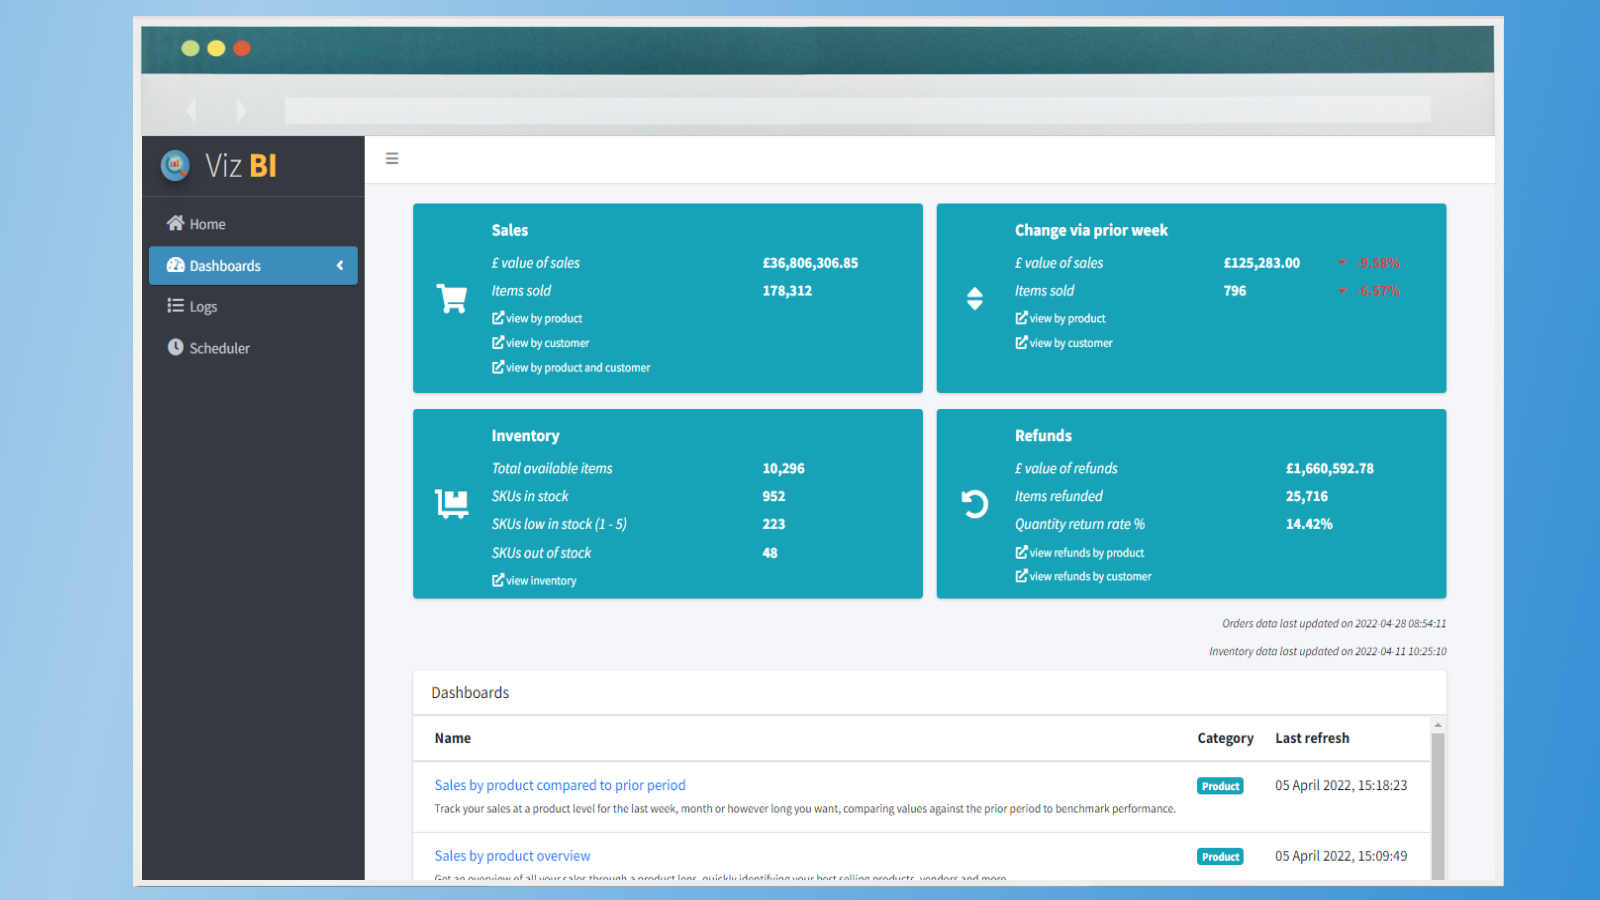
- Track and compare performance across date periods of your choice
- Interactive charts means one click of a bar will filter the whole dashboard
- Simply switch your chart values between sales values, quantities, refunds + more
- ハイライト
- 管理画面で直接操作
レビューはまだありません
サポート
Viz BIに関するご質問にはWentworth Analytics Ltd.がお答えいたします。
開発者
Wentworth Analytics Ltd.
9, Wentworth Park Avenue, Birmingham, ENG, B17 9QU, GB
リソース
この開発者は日本語での直接的なサポートを提供していません。
類似のアプリ
5.0
5つ星中
合計レビュー数:157件
•
無料プランあり
Boost ads ROI with Server Side tracking multi pixel installer