Viz BI
- 요금제
-
무료
- 평점
- 0.0 (0 리뷰)
추천 이미지 갤러리
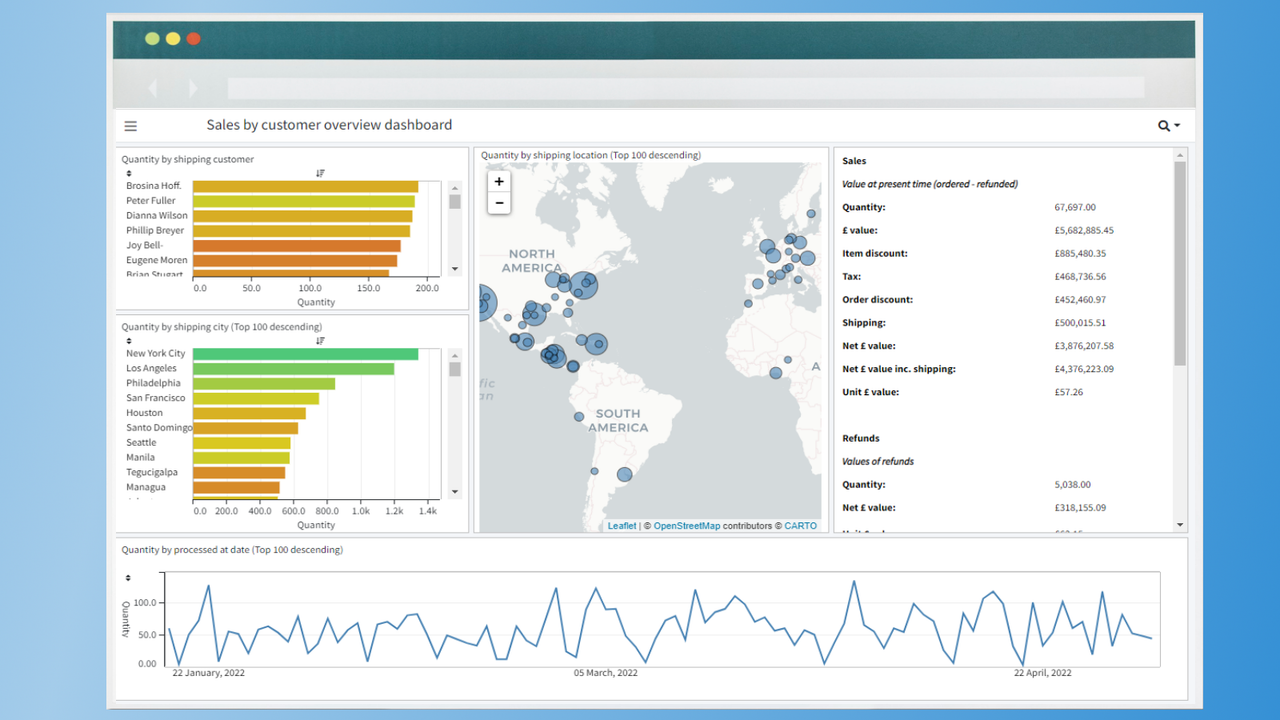
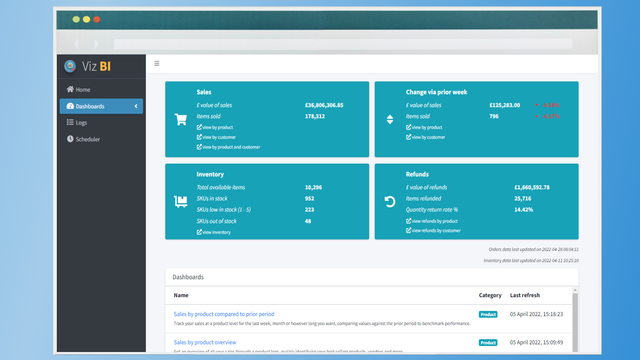
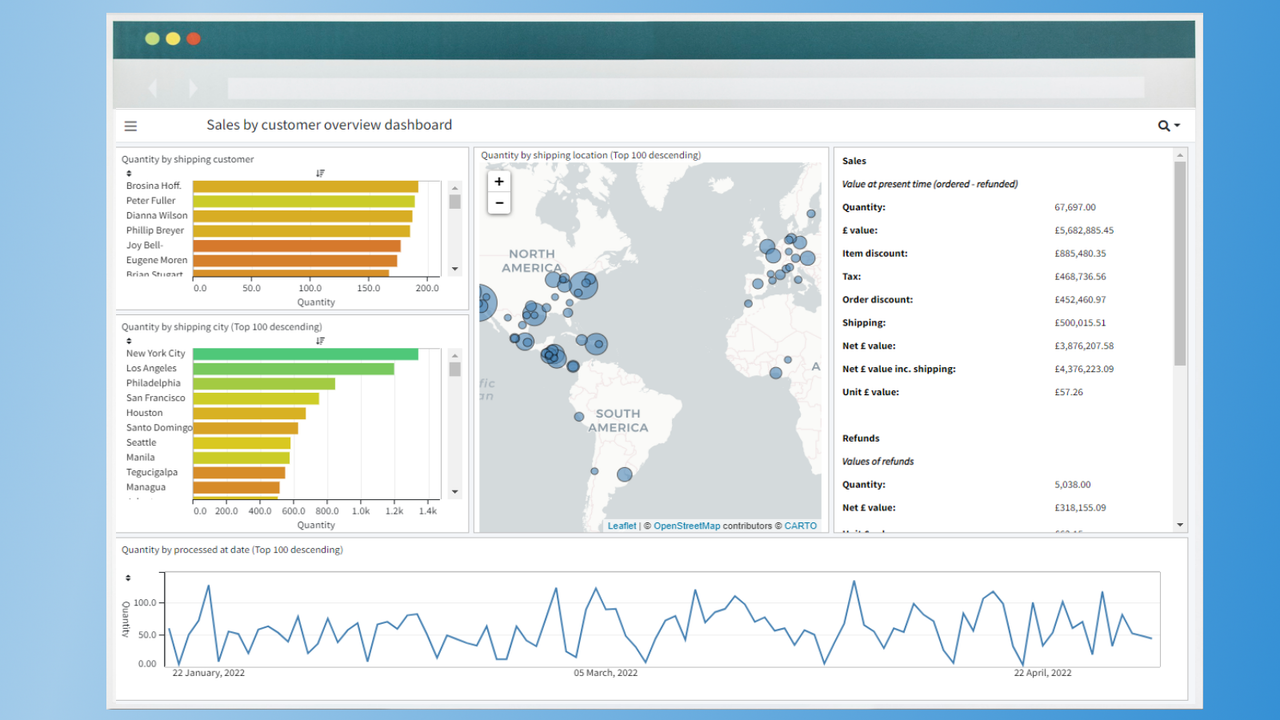
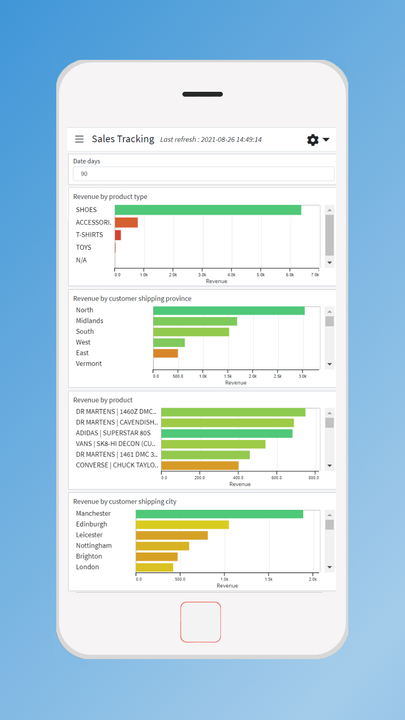
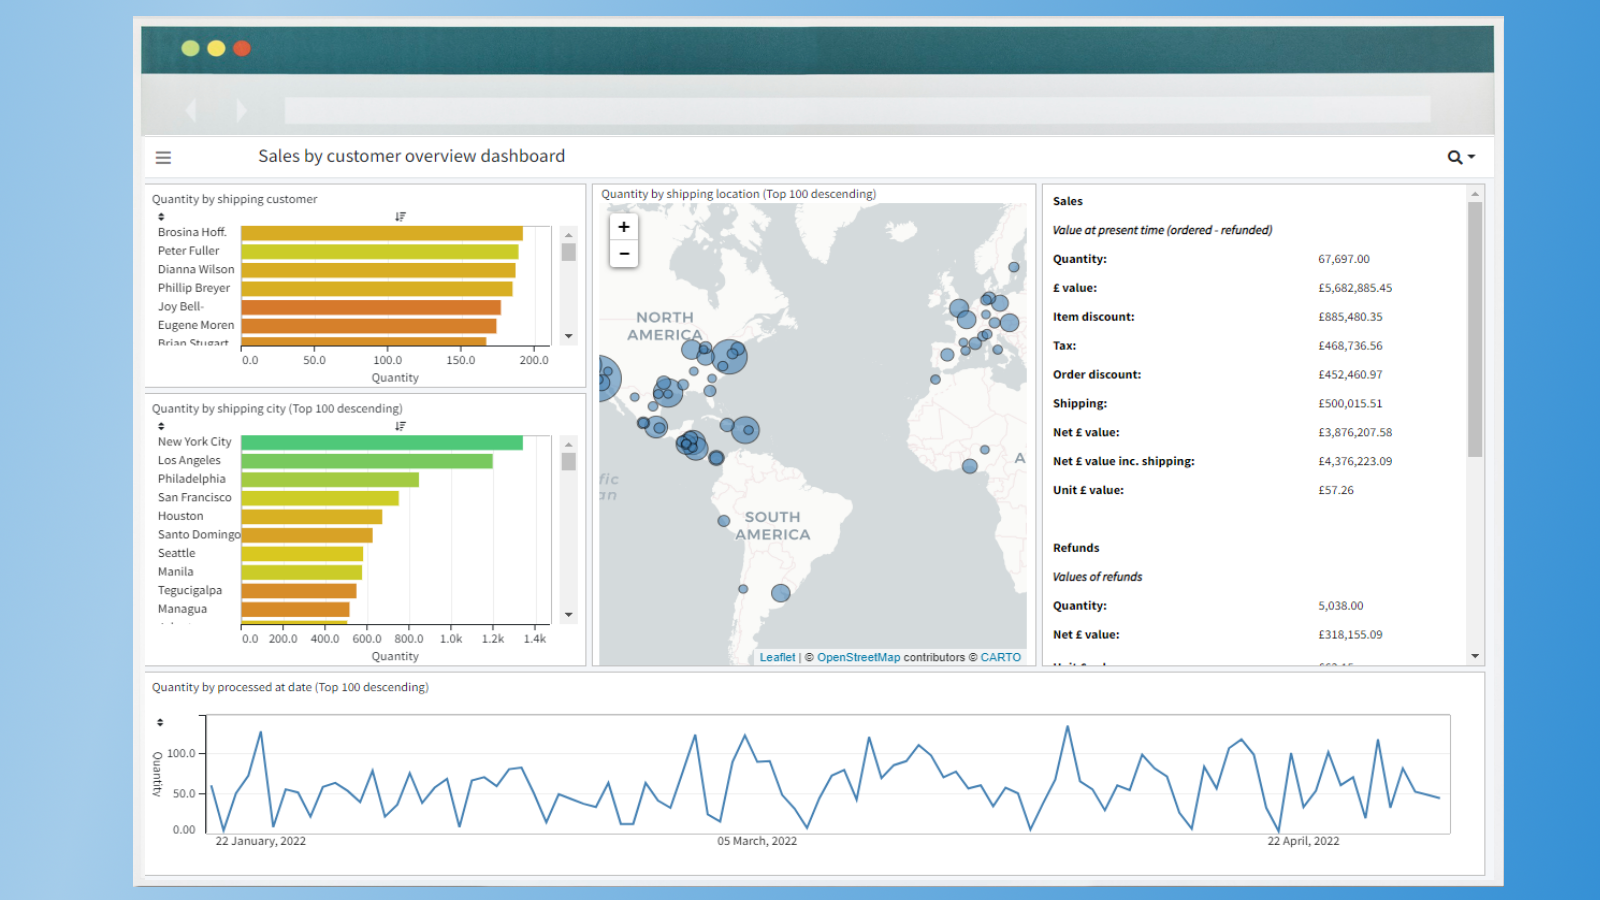
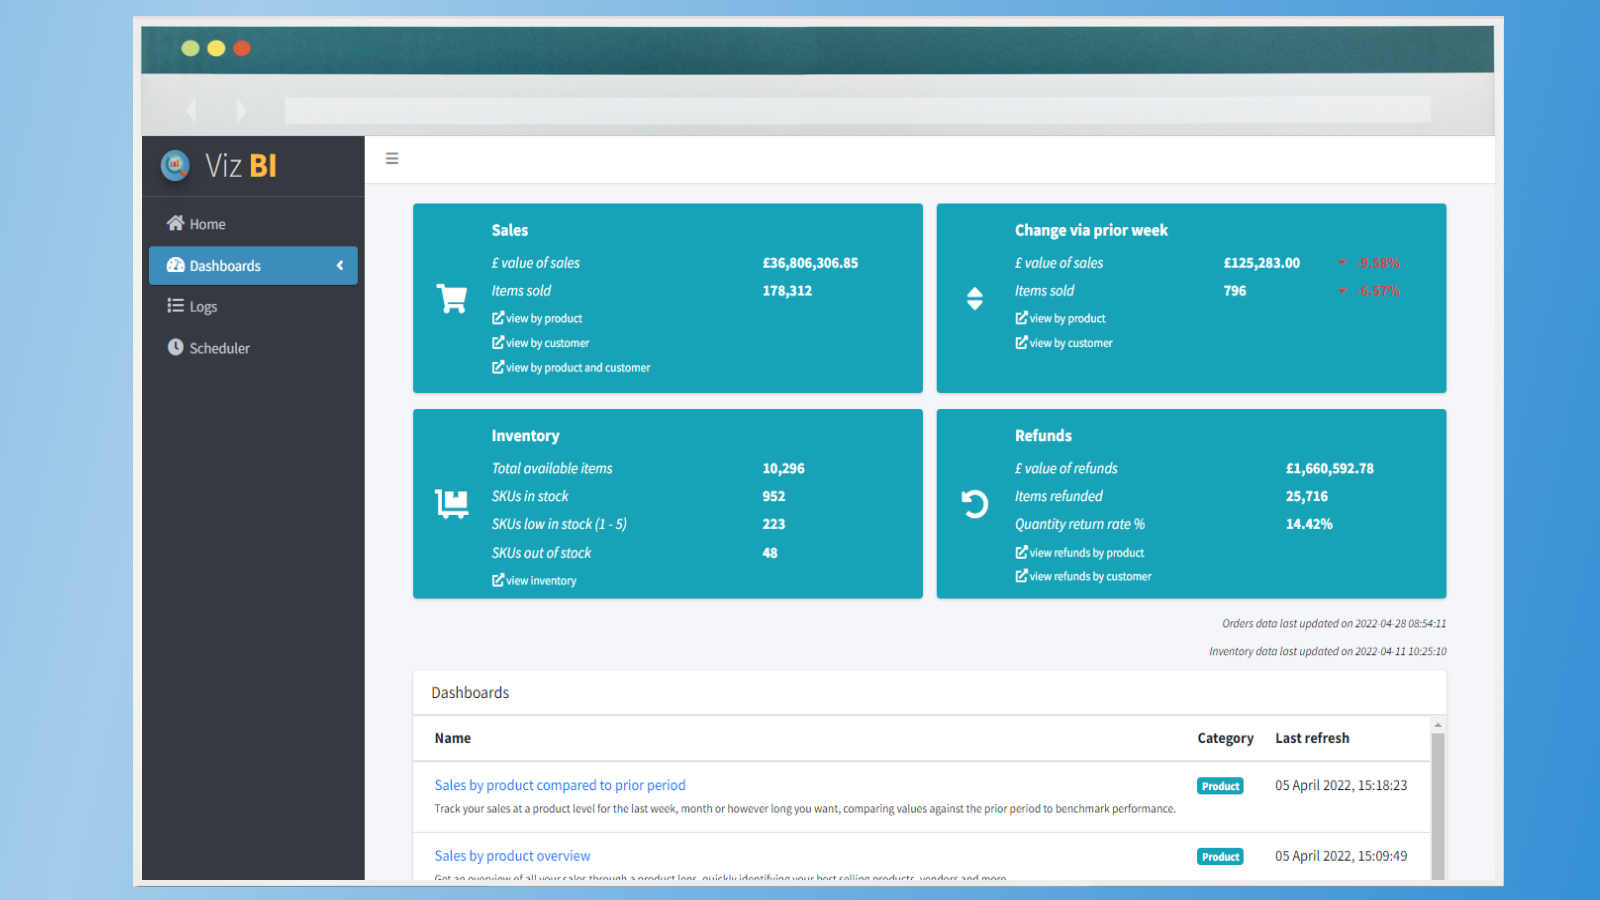
Viz BI provides a series of intuitive dashboards, allowing you to easily understand your store data
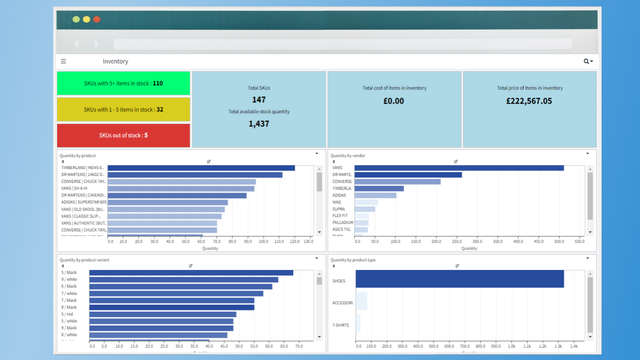
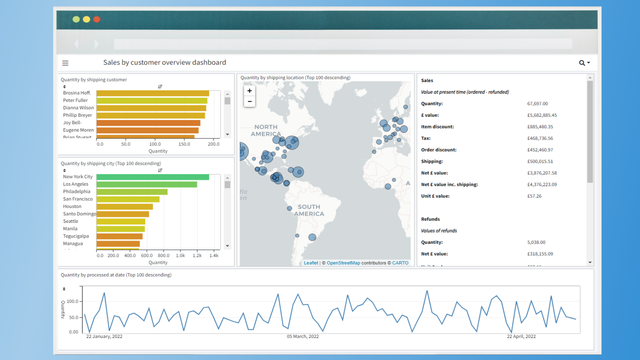
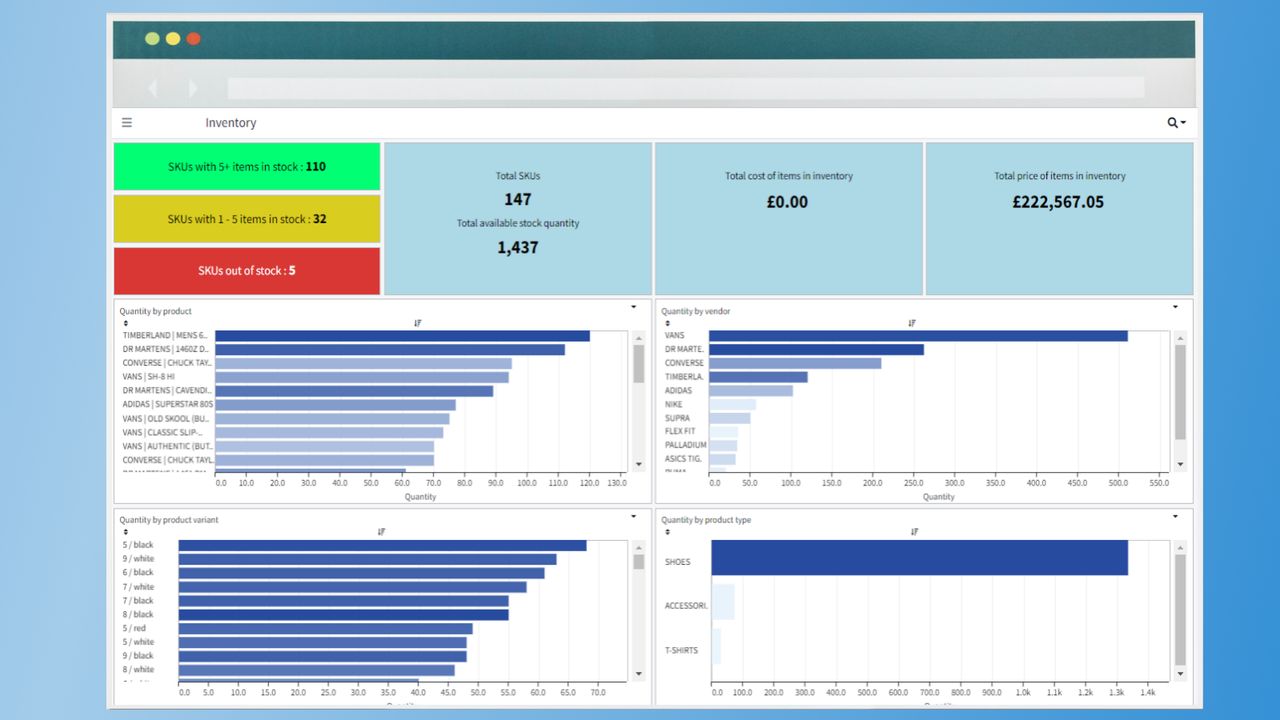
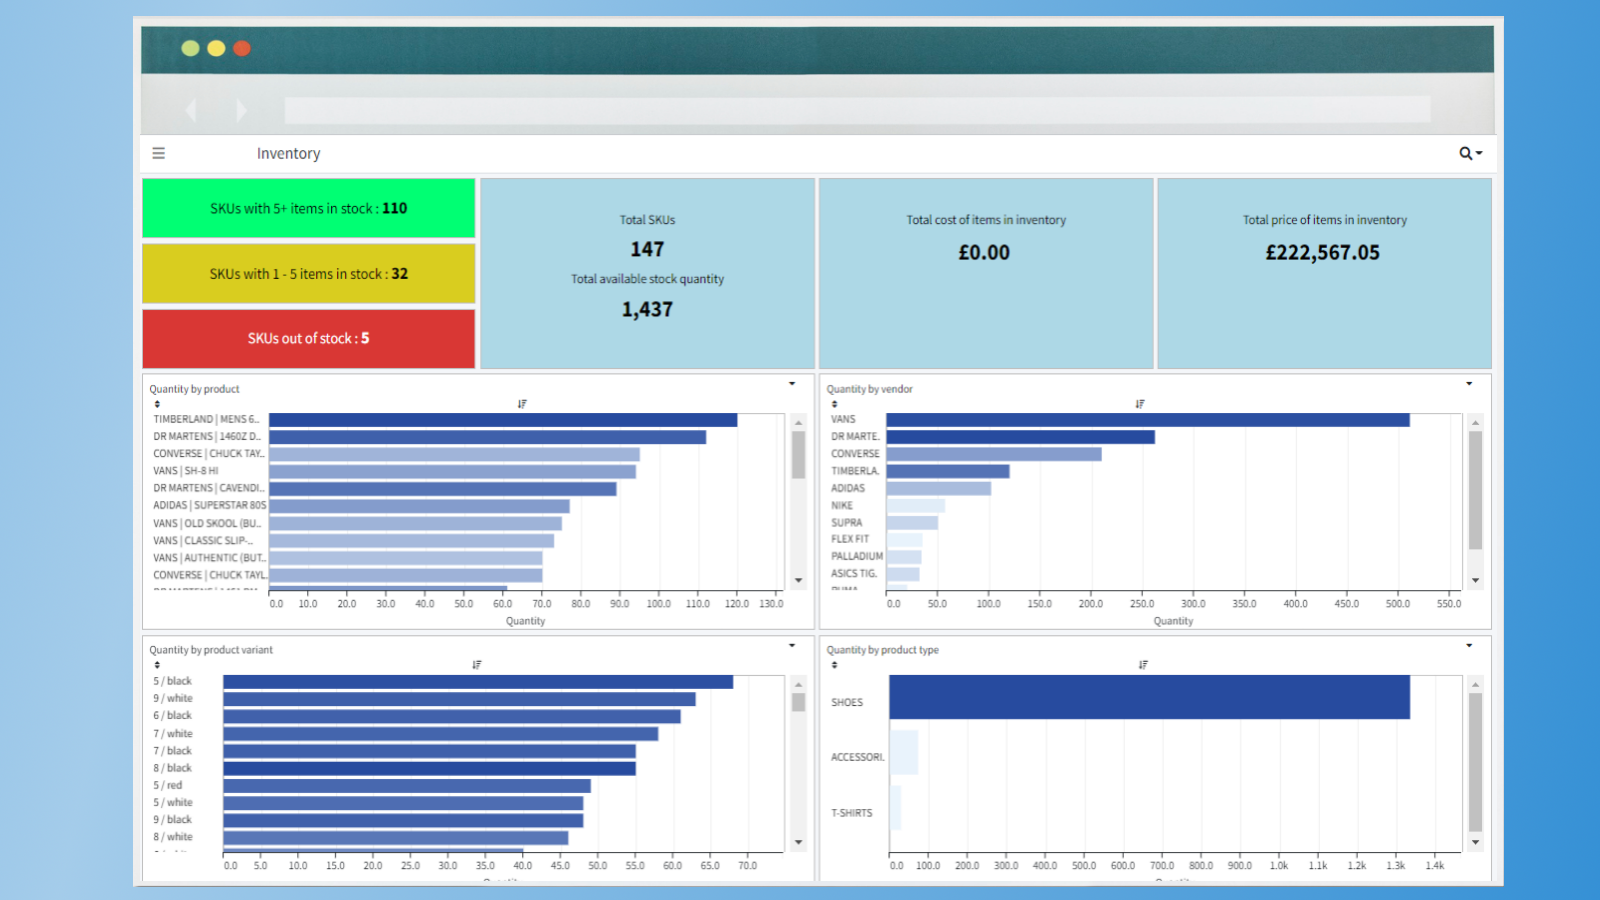
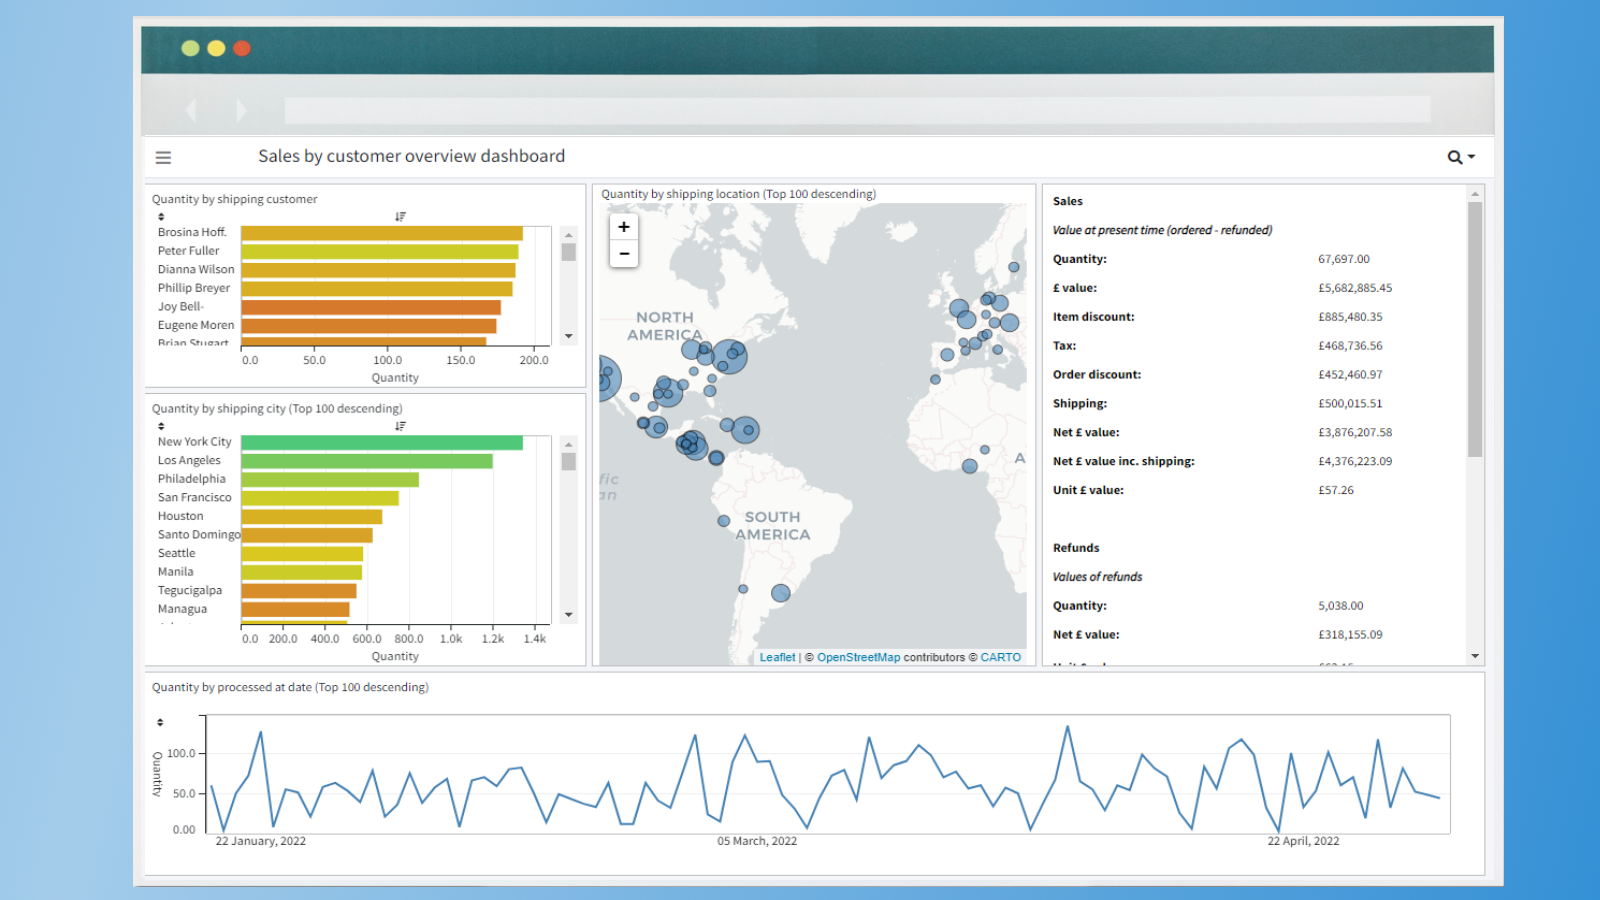
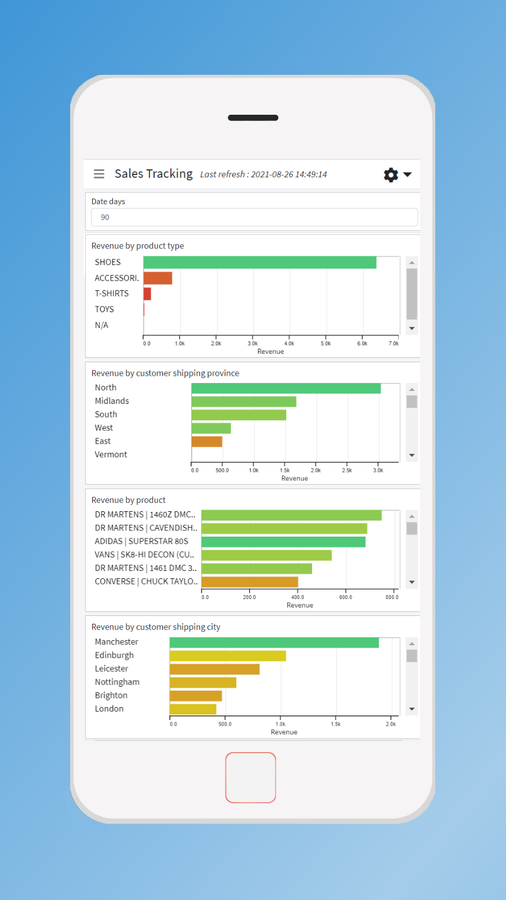
Viz BI takes your store data - orders, products, customers and more - and transforms it into interactive, easy to understand charts. These charts are then combined into dashboards, providing you with a full picture of your stores performance across a whole range of attributes. Within a matter of clicks you can : • follow which products are trending and which are falling • identify problem items that keep being returned • keep check of inventory, ensuring top sellers are always available
- Track and compare performance across date periods of your choice
- Interactive charts means one click of a bar will filter the whole dashboard
- Simply switch your chart values between sales values, quantities, refunds + more
언어
영어
이 앱은 한국어로 번역되지 않았습니다
리뷰
-
평점의 0%가 별 5개입니다
-
평점의 0%가 별 4개입니다
-
평점의 0%가 별 3개입니다
-
평점의 0%가 별 2개입니다
-
평점의 0%가 별 1개입니다
지원
앱 지원은 Wentworth Analytics Ltd.에서 제공합니다.
리소스
이 개발자는 한국어(으)로 직접 지원을 제공하지 않습니다.
개발자
9, Wentworth Park Avenue, Birmingham, ENG, B17 9QU, GB
출시됨
2021년 10월 18일
이 앱과 비슷한 더 많은 앱 보기


